
Adam Yee/iStock Editorial via Getty Images
Thesis
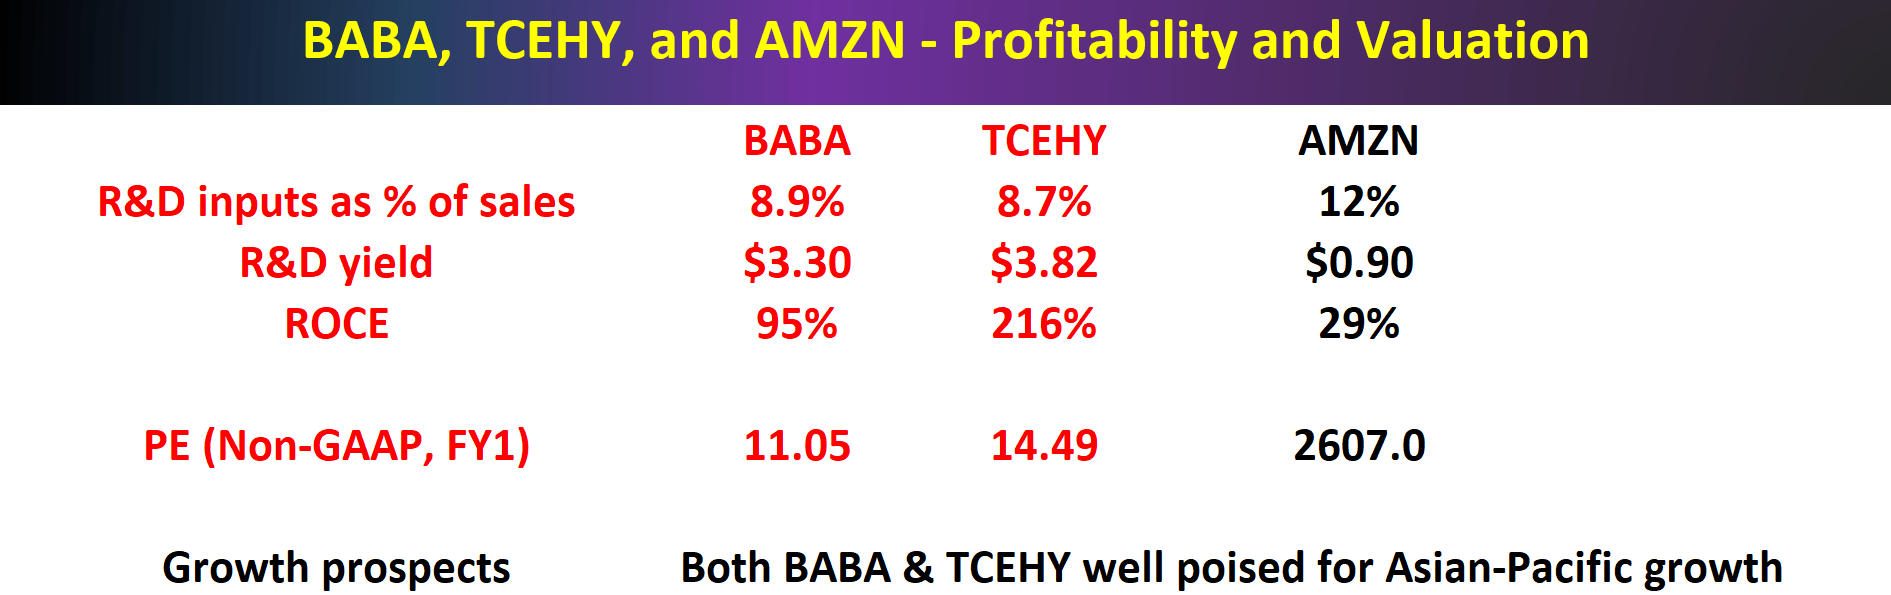
There seems to be little disagreement among bulls and bears that both Alibaba Group (NYSE:BABA) and Tencent Holdings (OTCPK:TCEHY) are firmly in value territory. The following two charts provide a quick summary of their key valuation and profitability metrics. I think it is reasonable to benchmark BABA against Amazon (AMZN) given that they share more similarities than differences in their business fundamentals. But it is hard to find a counterpart for Tencent: it’s kind of a combination of all the FAAMG businesses.
Regardless of the differences in their business details, the overall picture from these two charts is so overwhelming. With an FY1 PE in the range of 11x to 14.5x, both BABA and TCEHY are so cheaply valued both in absolute terms and relative terms compared to peers like AMZN or the overall market. Yet, their profitability rivals the best of the stocks in the market. As to be elaborated on later, their ROCE (return on capital employed) is more than 2x higher than the average of the FAAMG group (around 55%), and their R&D yield is almost 2x higher than the FAAMG group.
Source: Author based on Seeking Alpha data
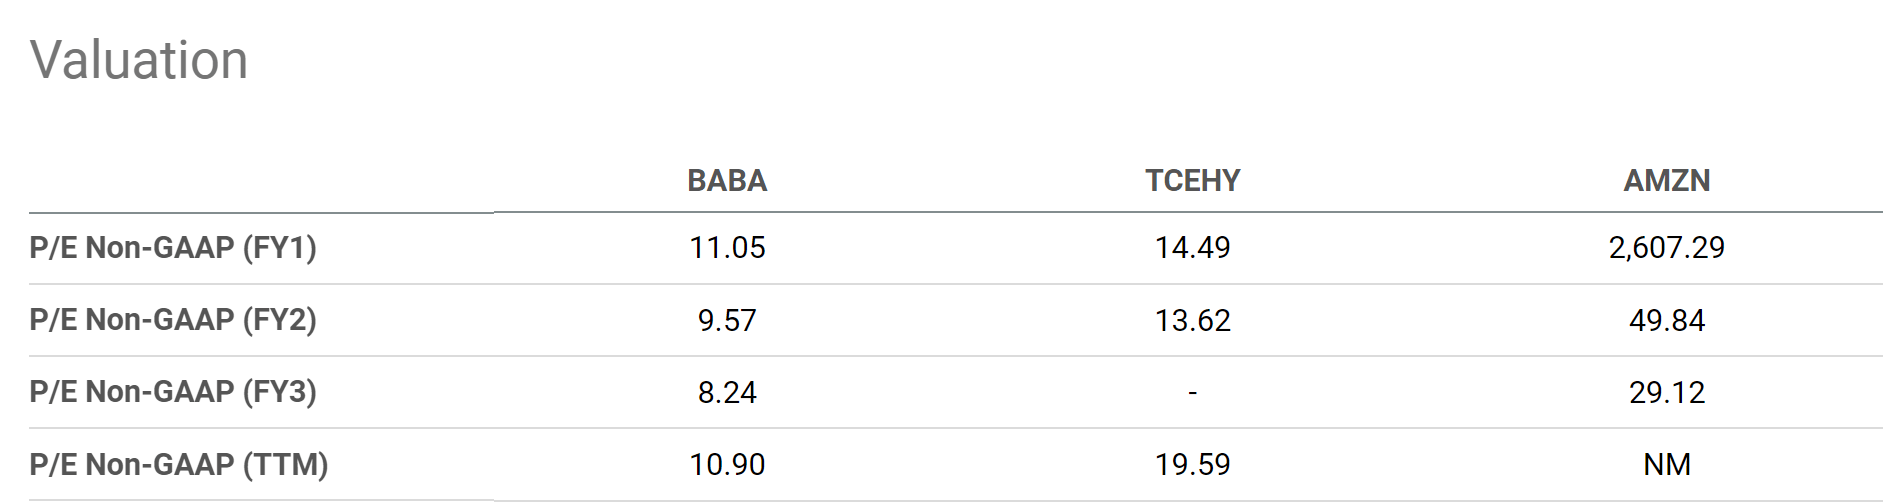
Source: Seeking Alpha data
Based on our discussions with SA readers and other investors lately, the key issue where many bulls and bears disagree is simply this: can value investing work in China? It is a fair and completely logical question. The fact that we can admit they are value stocks does not mean they are good investments, because value investing may not work in China.
Besides being logical, the question is also well supported by facts. And the chart below provides an example. The chart compares the price returns, i.e. with dividends excluded, from the SSE Composite Index (000001.SS) in the past 5 years against those from the S&P 500. As seen, the SSE Composite Index lost a total of 9.09% while the S&P 500 gained a total of 47.62%. Changing the timeframe does not seem to change the picture too much. For example, when we extend the timeframe to the past 10 years, the SSE Composite Index gained a total of 42.4% – which seems like good news. But the S&P 500 gained more than 169%. So the relative lag is even wider.
In the remainder of this article, I will provide my two cents on this debate. Also, my opinion is that I don’t see any reason why value investing should not work in China. In my mind, the idea of paying less to buy more is so universal and timeless that I do not see why it would stop working, as to be elaborated on next.

Source: Yahoo data
Historical perspective
First, let me provide a piece of counter-evidence to the chart above by going back further in history. The chart below was taken from a lecture Li Lu gave in 2015. Readers unfamiliar with Li Lu can take a look at our recent article and I highly encourage you to read the transcript of this lecture in its entirety.
The chart compares the performance of China’s stock markets versus the U.S. between 1992 and 2015. As seen, the Shanghai Stock Exchange indexes have grown 1406% during this time at an IRR of 12.1%. And the Shenzhen indexes have grown even more, 1864%, during this time at an IRR of 13.4%. Both growths have far outpaced all the major U.S. indexes. To wit, the Shanghai Stock Exchange indexes’ 1406% growth outpaced the S&P 500 by 2.12x, the DOW Jones by 1.73x, and the NASDAQ 100 index by 1.63x.
It is true that in the past decade, returns from the China stock markets have lagged the U.S. substantially. But bear in mind that A) the U.S. stock markets have suffered its “lost decades” too multiple times in the past; and B) like all performance comparisons, the conclusion often changes when the timeframe changes.
Next, we will see if history can offer some insights into the future.

Source: Li Lu 2015 lecture
Which direction would China stocks go next?
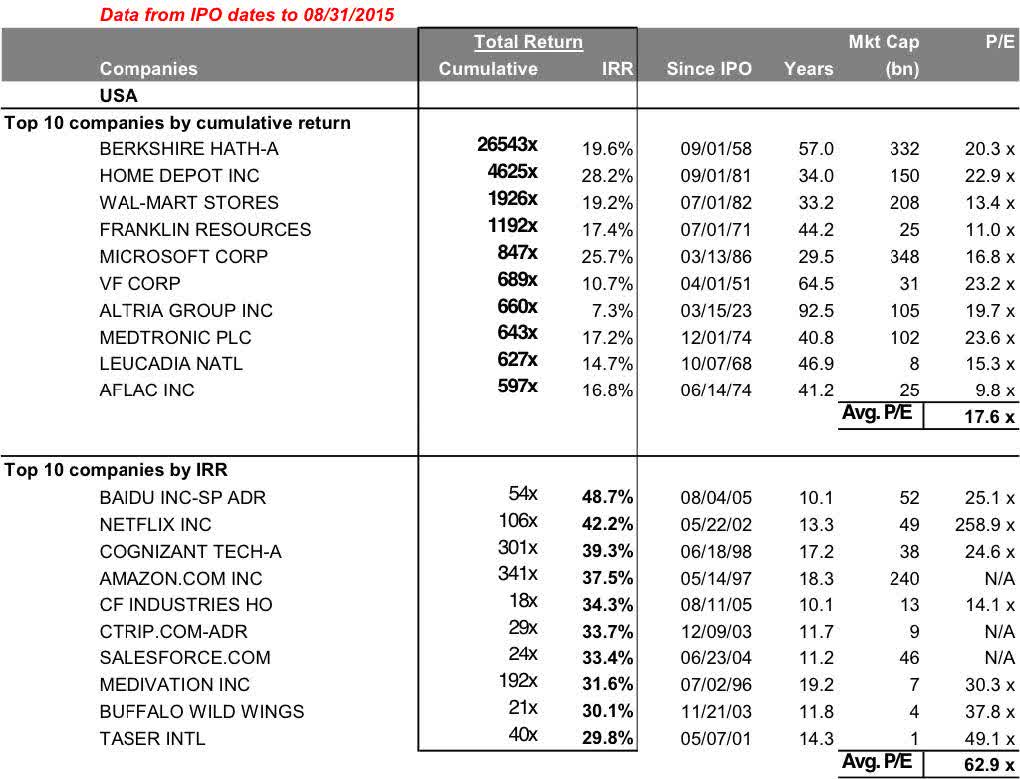
After the above macro-level view, now let’s descend and look at the specific stocks. The top panel of the following chart shows the best-performing U.S. stocks since their IPO. And you see all the familiar names on this list. And you cannot help but notice that this list is dominated by “old economy” stocks such as insurance conglomerates such as Berkshire (BRK.A) (BRK.B) and Aflac (AFL), chain retailers such as Home Depot (HD) and Walmart (WMT), and consumer staples like V.F. Corp. (VFC) and Altria (MO). The picture is very similar if you make a list of the best-performing China stocks since their IPO on the Shanghai or Shenzhen stock exchanges. The list is also dominated by “old economy” stocks like China Vanke (OTCPK:CHVKF) (OTCPK:CHVKY) (real estate), Gree Electronics (home appliances), Yunnan Biaoyao Medicinal (Healthcare), Kweichow Moutai (liquor), et al.
The bottom panel of the following chart shows the best-performing stocks by IRR. And now you see the pictures change in two dramatic ways. First, the list is dominated by “new economy” stocks that went IPO primarily around ~2000 such as Baidu (BIDU), Netflix (NFLX), Amazon (AMZN), Ctrip (TCOM), and Salesforce (CRM). And secondly, you see that quite a few Chinese companies listed in the U.S. stock market have made the top 10 list such as Baidu and Ctrip.
Such a historical perspective leads me to the following recognition about BABA and TCEHY: what has happened to them so far is a hiccup along the way an unstoppable secular shift from the old economy to the new economy. The shift is equally unstoppable in both the U.S. and China. And I won’t be surprised to see BABA and TCEHY appearing on the list when we update it 10 years from now.
Next, I will provide a few business specifics about BABA and TCEHY to support my above view.
Source: Li Lu 2015 lecture
Both R&D aggressively and enjoy superb yield
As mentioned in our earlier writings, we do not invest in a given tech stock because we have high confidence in a certain product that they are developing in the pipeline. Instead, we are more focused on A) the recurring resources available to fund new R&D efforts sustainably, and B) the overall efficiency of the R&D PROCESS.
So let’s first see how well and sustainably BABA and TCEHY can fund their new R&D efforts. The short answer is: extremely well. The next chart shows the R&D expenses of BABA and TCEHY over the past decade. As seen, both have been consistently investing heavily in R&D. BABA spends on average 8.9% of its total sales on R&D efforts, and TCEHY on average 8.7%. Both levels are consistent with the average of other leaders in the tech space. For example, in the FAAMG group, AMZN spends about 10% of total revenues on its R&D, MSFT about 13%, and AAPL about 6.1%.
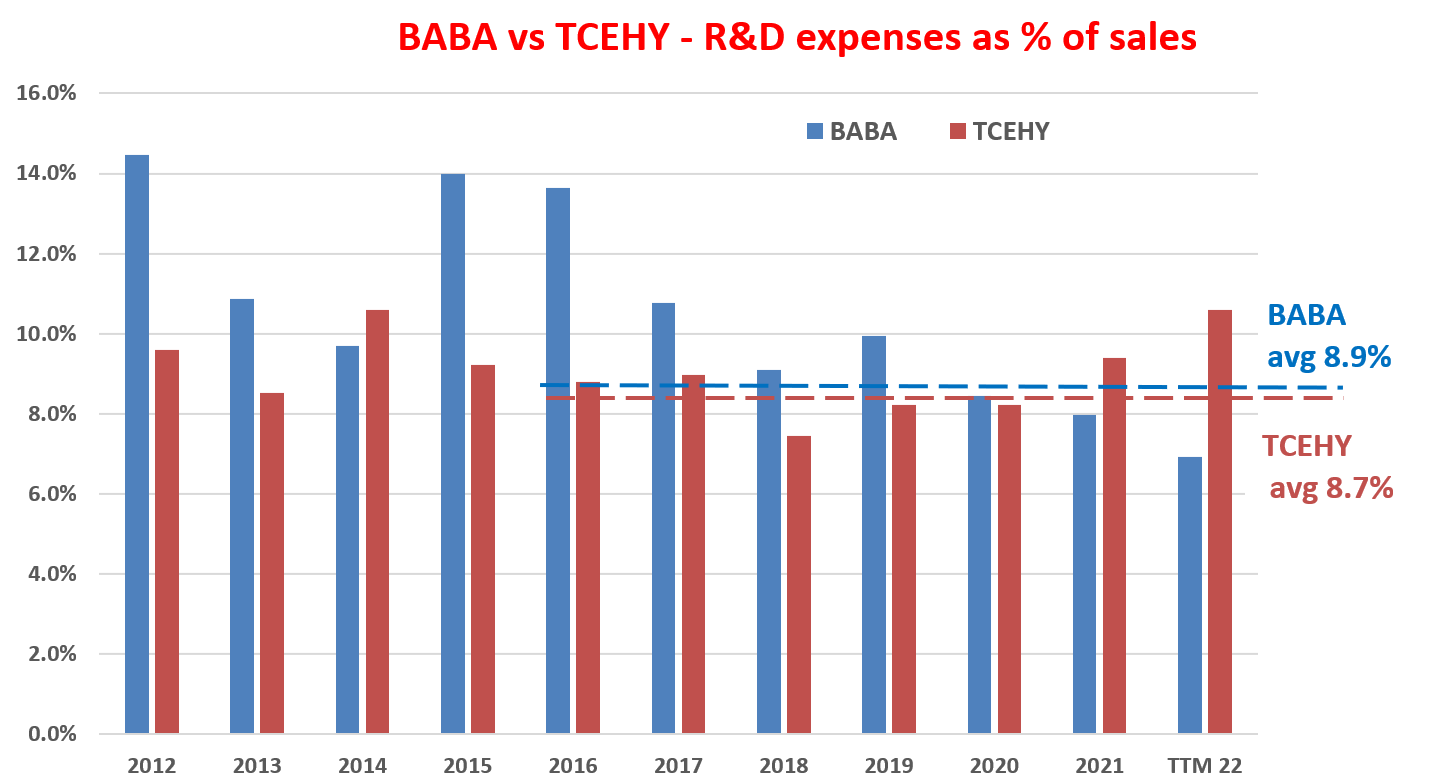
Source: Author based on Seeking Alpha data
Then the next question is, how effective is their R&D’s process? The next chart shows a variation of Buffett’s $1 test applied to R&D expenses for BABA and TCEHY. The analysis method is detailed in our earlier writings and in summary:
- The purpose of any corporate R&D is obviously to generate profit. Therefore, this analysis quantifies the yield by taking the ratio between profit and R&D expenditures. We used the operating cash flow as the measure for profit.
- Also, most R&D investments do not produce any result in the same year. They typically have a lifetime of a few years. Therefore, this analysis assumes a 3-year average investment cycle for R&D. And as a result, we used the 3-year moving average of operating cash flow to represent this 3-year cycle.
As you can see, the R&D yield for both has been remarkably consistent and also superb. In BABA’s case, its R&D yield has been steady around an average of $3.31 in recent years. TCEHY’s R&D yield of $3.82 is even higher than BABA’s. To put things under perspective, let’s compare such levels of R&D yield again to the overachieving FAAMG group, which boasts an average R&D yield of around $2 to $2.5 in recent years. And in particular, BABA’s closest peer in the group, AMZN generates a yield of around $0.9 only.
Next, we will examine their profitability to fuel their R&D efforts sustainably and also project their growth rates.

Source: Author based on Seeking Alpha data
Both enjoy superior profitability too
As explained in our earlier writings, to us, the most important profitability measure is ROCE (return on capital employed) because:
ROCE considers the return of capital ACTUALLY employed and therefore provides insight into how much additional capital a business needs to invest in order to earn a given extra amount of income – a key to estimating the long-term growth rate. Because when we think as long-term business owners, the growth rate is “simply” the product of ROCE and reinvestment rate, i.e.,
Long-Term Growth Rate = ROCE * Reinvestment Rate
In this analysis, I consider the following items capital actually employed A) Working capital (including payables, receivables, inventory), B) Gross Property, Plant, and Equipment, and C) Research and development expenses are also capitalized.
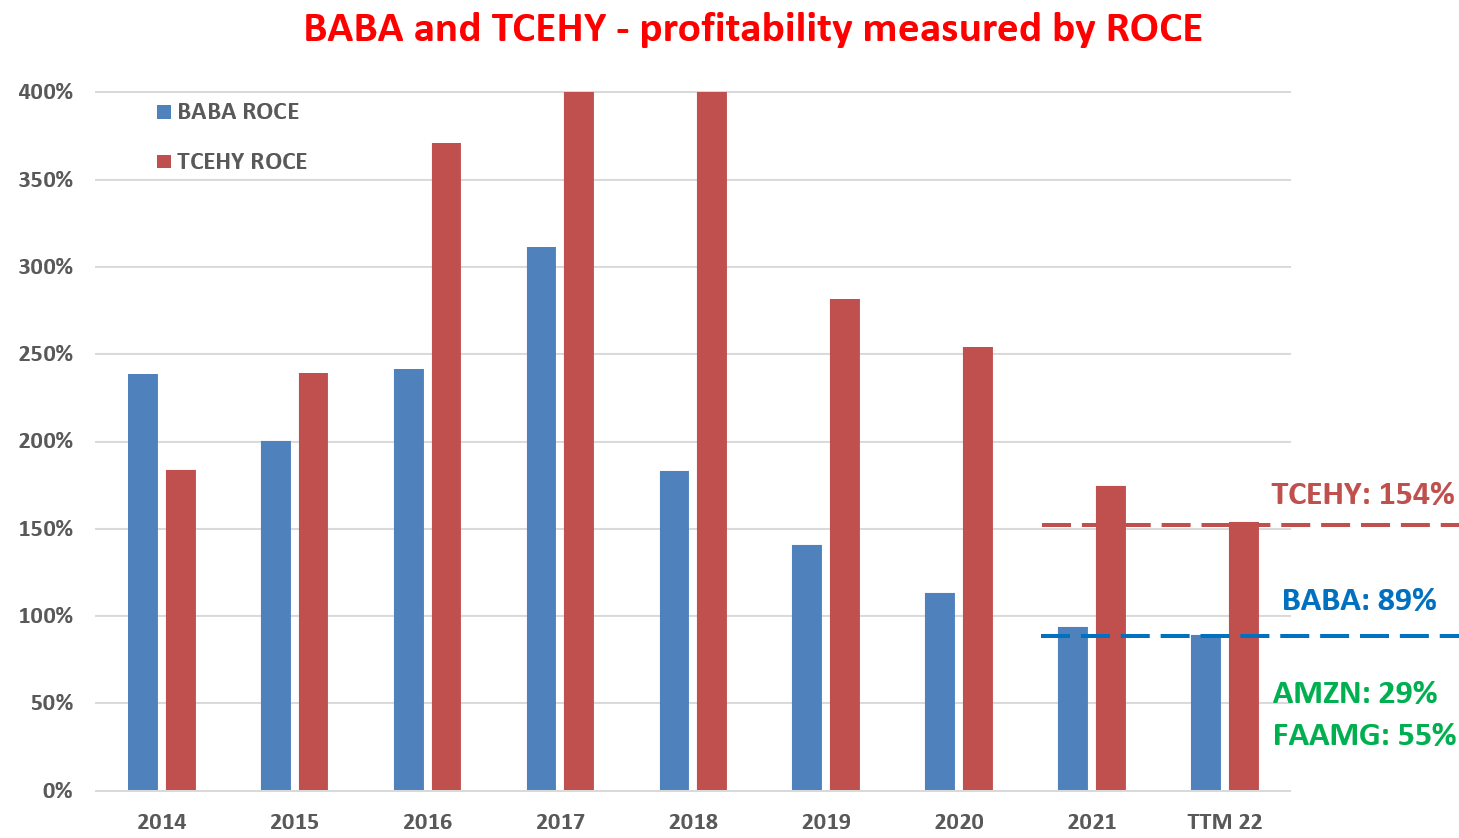
As you can see from the chart below, both BABA and TCEHY’s ROCE were literally off the chart till about 2019. They both enjoyed a ROCE on average exceeding 150% before 2019. To put things into perspective, AMZN’s ROCE is only about 29% in recent years. And the FAAMG group’s average ROCE has been about 55% in recent years. From this perspective, this is no wonder why the Chinese government had to tighten regulations and curb their profitability in recent years. And as you can see, their profitability did suffer and declined since then. But even after the decline caused by regulations and tax rate changes, their current ROCE is still above 89% for BABA and about 154% for TCEHY.
Source: Author based on Seeking Alpha data
Growth prospects and final verdict
As such, looking forward, I see both as well-poised to sustainably fund their innovation via their organic profits. Furthermore, as mentioned above, I also see both best poised to benefit from the secular trend of e-commerce and digitalization not only in China but also globally. Currently, 80% of the commerce is still currently conducted offline and eCommerce only accounts for a total of 20% of the total. The remainder of the digital revolution will be unevenly distributed geographically and the Asia-Pacific region will be the epicenter. And leaders like BABA and TCEHY will be the best positioned to benefit as argued in my earlier article:
… the remaining shift will be unevenly distributed and the Asian-Pacific region will be the center of the momentum. As shown in the chart above, world retail e-commerce sales are expected to exceed $7.3 trillion by 2025. The twist is that the Asia-Pacific region will be where most of the growth will be. By 2023, the Western continents will contribute 16% of the total B2B e-commerce volume, while the remaining 84% would come from the non-Western world. And leaders like BABA and TCEHY are best poised to benefit with their scale and reach, government support, cultural compatibility with other Asian-Pacific countries, and also geographic proximity.
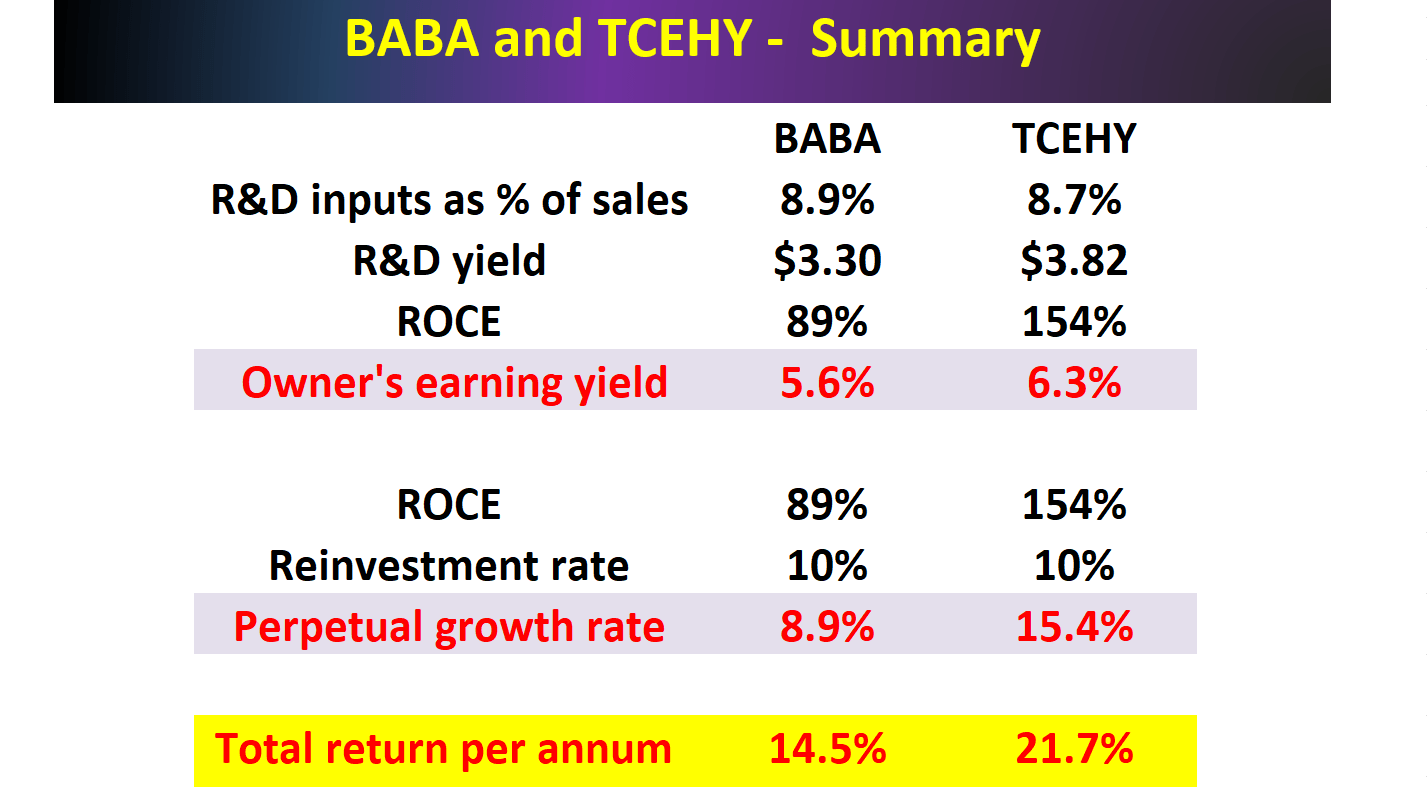
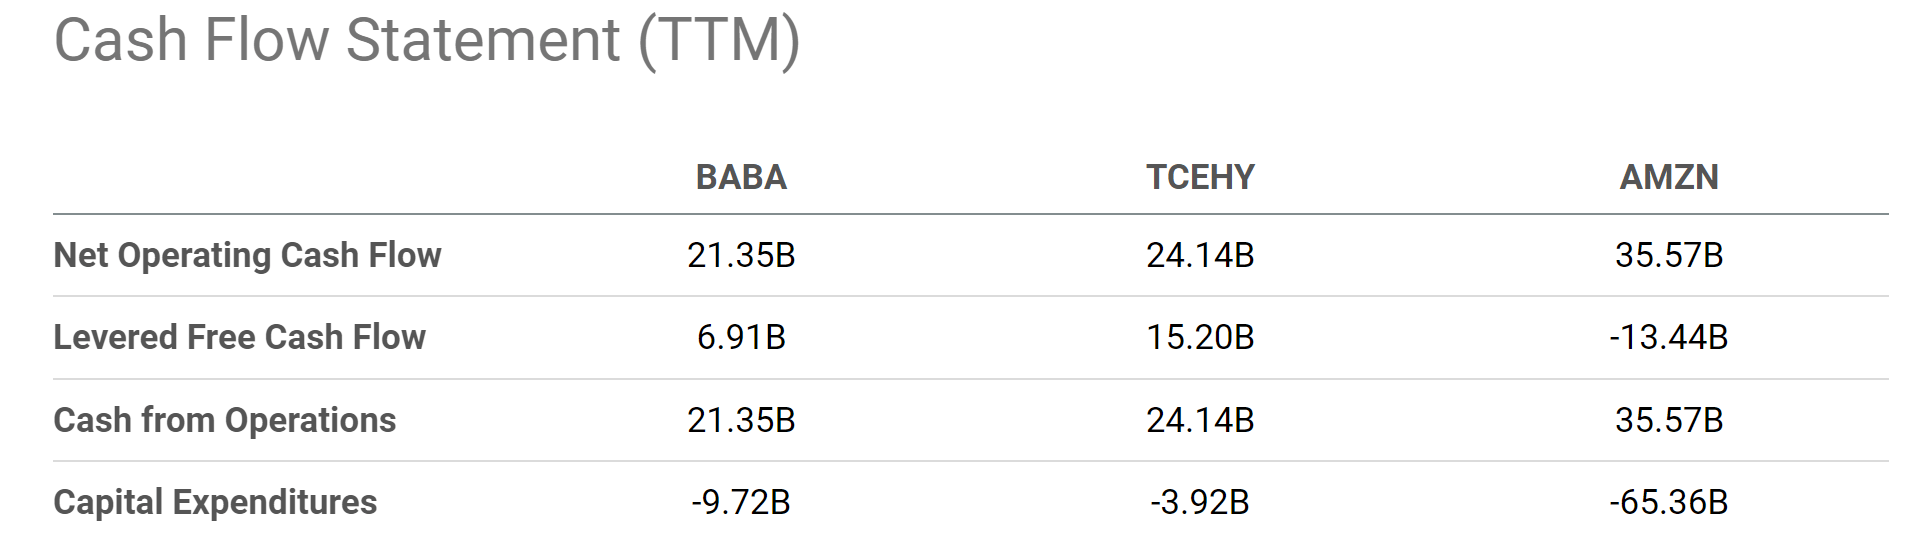
Finally, the following table summarizes all the key metrics discussed above. As mentioned early on, my thesis is that I don’t see why value investing would stop working here given the megatrend, their profitability, and their current valuation. To wit, their valuation is so low that they both provide a healthy owner’s earning yield (“OEY”): 5.6% for BABA and 6.3% for TCEHY at their current prices. And note here that I’m using the free cash flow taken from Seeking Alpha as shown in the second chart below to approximate their owners’ earnings. As such, this is a conservative estimate for their OEY, because the true owners’ earnings will be free cash flow plus the growth part of their CAPEX expenses.
For growth, BABA is projected to grow at 8.9% assuming a reinvestment rate of 10% and its current ROCE of 89% (Perpetual growth rate = 89% ROCE * 10% reinvestment rate = 8.9%). And for TCEHY, the growth rate would be even higher, 15.4%, if we assume the same 10% reinvestment rate because of its higher ROCE of 154% (Perpetual growth rate = 154% ROCE * 10% reinvestment rate = 15.4%).
All told, BABA is projected to provide a 14.5% total return per year (5.6% OEY plus 8.9% growth) and TCEHY 21.7% (6.3% OEY plus 15.4% growth).
Source: Author based on Seeking Alpha data
Source: Seeking Alpha data
Risks and final thoughts
There are a couple of risks worth mentioning, especially in the near term. Firstly, their ROCE might shrink from the current levels either due to the slowdown of the overall Chinese economy or due to further regulatory changes. Secondly, they may not always be able to find high-margin and high-growth areas to reinvest. The above projections were made under the assumption that A) they always find new opportunities with returns matching their current ROCE, and B) the opportunities are sizable enough to absorb a 10% reinvestment rate. Although under current conditions, even if the growth rates are cut by half due to a combination of A and B, their total annual returns would still be in the double digits.
To conclude, a key disagreement between many bulls and bears surrounding BABA and TCEHY is not about their valuation or profitability. The key disagreement is simply whether value investing can work in China or not. The question is not only logical but also well supported by recent facts (say the performance of the China stock market, BABA stock prices, and TCEHY prices in the past 5 or 10 years). However, by widening the perspective, my view is that what happened to BABA and TCEHY recently is a hiccup along the way of an unstoppable secular shift from the old economy to the new economy.
Techyrack Website stock market day trading and youtube monetization and adsense Approval
Adsense Arbitrage website traffic Get Adsense Approval Google Adsense Earnings Traffic Arbitrage YouTube Monetization YouTube Monetization, Watchtime and Subscribers Ready Monetized Autoblog
from Investing – My Blog https://ift.tt/VmHxnSW
via IFTTT


