
BsWei
From January 4, 2022 to June 17, the S&P 500 (using the index tracking ETF, SPY) was down 24.5%, giving up about 18 months of price gains. As I wrote throughout this period in my trading blog (free access to Followers), I expected the markets to go lower. And the day after the rebound that tagged the 200 day moving average on August 16, I again shared my expectation that a short-term top was in and that the SPY would revisit the June lows. I still carry this expectation.
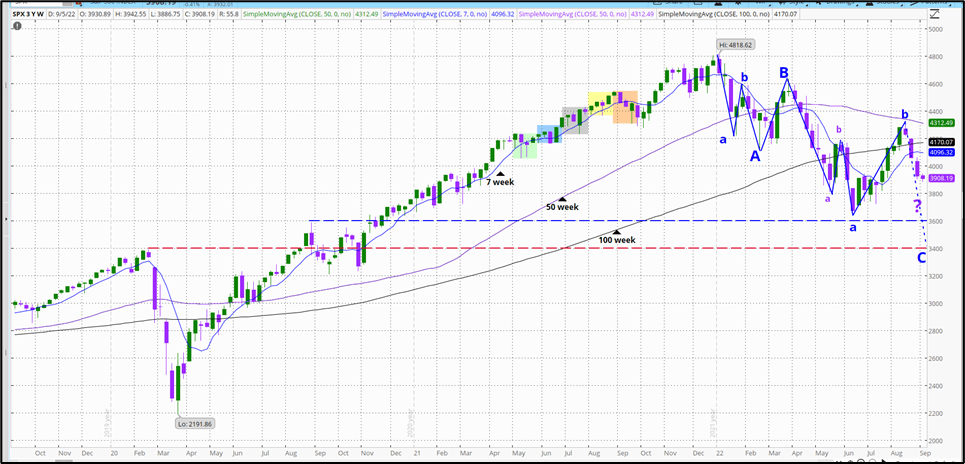
In the past I often referred to the form of the market using Elliott Wave (“EW”) theory. With the passing a few years ago of Tony Caldaro, whose approach I favored, the larger pattern has been lost on me. However, with the correction in 2022 after a strong uptrend, I think that I might identify a classic 3-part (A-B-C) corrective move, with subdividing fractals, which I have outlined on the weekly 3-year chart below for the SPX using my TD Ameritrade Thinkorswim platform.
SPY 3 yr chart (author)
Other EW practitioners may easily find rule violations in my depiction here, but if this is a possible pattern, it suggests to me that a re-test of the June low is very likely. A “bottom” may occur at either the pre-COVID high (red dashed line) or the breakout following the post-COVID rebound (blue dashed line). So this is just a general guide for me at this point – and subject to change – for what I am expecting for this bear market.
So what do I make of this year for managing my investments? I continue to be confident that this is a fine opportunity to increase my longer-term returns. A brief summary for how the stage has been set for this is in order.
Investment Strategy
While I was working, my family lived within our means, saved, and contributed to Roth IRAs and to employer 457 deferred compensation plans. Also, just before it was terminated, we were fortunate to grab the Social Security “file and suspend” program, allowing us to each take full Social Security income at age 70, a potentially 32% gain per year for life over taking payments at age 66 (with “break-even” at survival to about age 83). Just before I retired in early 2017, I changed my primary 457 plan investment to their fixed annuity option, which paid 3.5%, in order to protect my decades of contributions from any major corrections. With a troubled 1Q 2018, a bear market in 4Q 2018, the COVID recession in 1Q 2020, and now the 2022 bear, that wasn’t a horrible choice.
I then started rolling funds out of my 457 plan into my IRA and then immediately did Roth IRA conversions. The tactic here was to roll out only enough contributions so as to stay within my current tax bracket, and to do this at the end of the tax year so as to avoid having to prepare estimated taxes. We saved the additional money for the Roth contribution so as to not eat into the amount being rolled over. Given the limitations of paying the (Roth contribution) tax and staying in the same tax bracket, it has taken 5 years (including 2022) to roll over my retirement funds from my 457 plan into my Roth IRA.
Even at age 72, I am confident that I can do far better than leaving my retirement funds in my 457 plan with its “vanilla” mutual fund choices as some call them. And my Roth is transferrable to my beneficiaries to enjoy for 10 years. So for now, everything I earn is forever tax-free. With each of us having a comfortable balance, our investments are there for retirement, long-term care, or whatever other opportunities or challenges may come our way. This is in addition to our Social Security payments and multiple pensions.
We learned these strategies by reading, attending numerous “dinner seminars” that wealth management companies offer to those on the doorstep of retirement, and by exploring the recommendations of tax guru Ed Slott.
Core Investment Strategy
As I have presented in articles previously, I use a two-part investing strategy to increase my income, manage risk, and increase total return. This is a DIY approach that is saving, in my view, the 1.5%+/- in management fees often charged by professional investment managers. It is also very “high-touch” management, which is often less common among commercial managers for us middle income folks.
The first part of my strategy is to earn steady, above-average income from fixed-income and other investments, primarily closed-end funds (“CEFs”), real estate investment trusts (“REITs”), and selected dividend stocks. The CEFs are a mix of equity, hybrid, and bond funds. The allocation of my capital to CEFs has grown significantly over the past few years.
The second part of my strategy is to swing and position trade individual stocks. As I have presented previously, I favor component stocks of the S&P 500 index that are under-performing their sectors, and the sectors that are under-performing the broader SPX on a relative basis.
The pie chart below shows the current allocation of investment by cost to CEFs, REITs, and individual stocks (including 1 preferred stock), at the close on August 31. The portfolio has 203 holdings, with 57 CEFs, 23 REITs, and 123 individual stocks, including 1 preferred stock. I also maintain a cash reserve that varies between 5-15% of the total portfolio value.
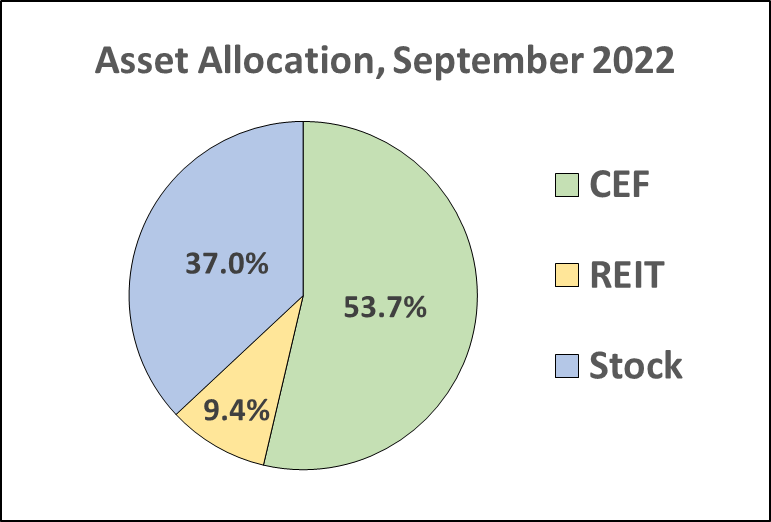
Asset Allocation (author)
Overall, my portfolio is very dynamic and is large. The reason for this, reflecting on the second part of my strategy, has nothing to do with diversification per se, but is instead a risk management tactic. Many have commented in response to my articles that this takes too much time or is too much work. That is subjective, as I do many other things than manage my portfolio, and I also absolutely love to trade anyway. This overview is to explain what I have done and what is working for me, and it is in no way a recommendation for others without doing your own due diligence.
Income
CEFs, REITs, and dividend stocks satisfy my desire to get paid from my investments all along the way. I have written that I like the “pay me now” approach given market volatility and the uncertainty of price appreciation when investments need to be cashed out. As I noted elsewhere, the income (dividends) portion of the S&P 500 over time is about 8%, whereas I can take home about 28% in the income portion (distributions) of the total return from a CEF like the Calamos Strategic Total Return Fund (CSQ).
Overall, my portfolio at the end of August was estimated to generate nearly $47k in income for the coming year, using the TD Ameritrade ‘Income Estimator’ tool. Those who know this tool also realize that it under-estimates the likely payout in that any dividend re-investments are not included, as well as proceeds from some funds that pay large special distributions at the end of the year. My goal is to soon reach the $50k a year level for income.
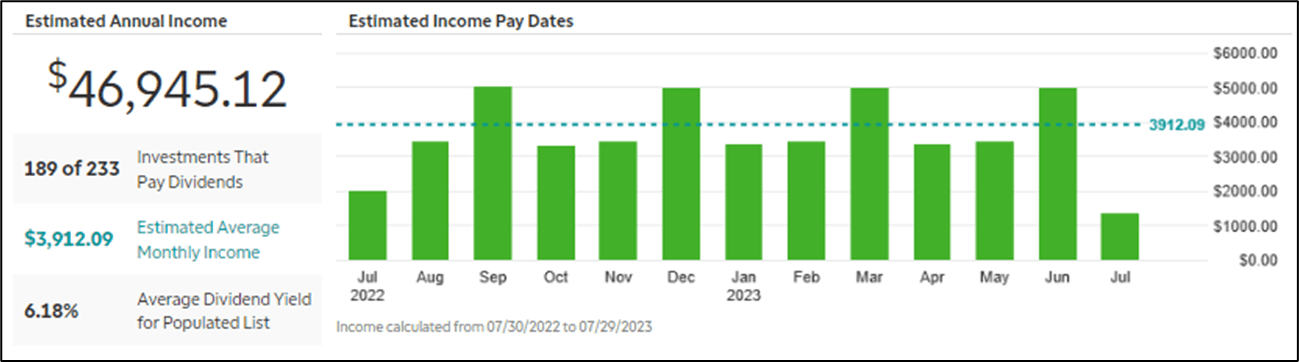
author
CEFs are the largest component of my income stream. I last wrote in January about why I like CEFs and how I buy them, and I listed all of my holdings. My CEF portfolio has continued to grow such that at the end of August, I held >29,700 shares across 57 CEFs. My allocation across funds is far from balanced, as I add shares incrementally over time in order to lower my unit costs. Of the 57 funds, 27 (47%) represent 72% of total investment. Because I grab shares on the cheap and many CEFs have pulled back with the market (after all, they are comprised of stocks and bonds just like mutuals and ETFs), my mean yield has increased, to 8.82% currently. CEFs currently provide >$24,800 or 74% of my total annual income.
In the interest of space, I’ll refer readers again to the January article, but my top 10 CEFs are currently:
- BlackRock Science and Technology Trust (BST)
- Reaves Utility Income Fund (UTG)
- DoubleLine Income Solutions Fund (DSL)
- Tekla Healthcare Investors (THQ)
- BlackRock Enhanced Equity Dividend Trust (BDJ)
- BlackRock Health Sciences Trust II (BMEZ)
- DoubleLine Yield Opportunities Fund (DLY)
- DNP Select Income Fund (DNP)
- Royce Value Trust (RVT)
- Cohen & Steers Quality Income Realty Fund (RQI)
The tickers for the 10 next largest CEF holdings by cost are: EMD, BIGZ, BIT, GDV, PDO, EOS, RMT, USA, BSTZ, and HTD.
Since my January article, I’ve added the following CEFs to my portfolio as prices have dropped with this bear market, including a few that were brought to my attention by readers of that article:
- Eaton Vance Tax-Advantaged Global Dividend Opportunities (ETO)
- Tri-Continental Corporation (TY)
- Flaherty & Crumrine Dynamic Preferred and Income Fund (DFP)
- Calamos Dynamic Convertible and Income Fund (CCD)
- Calamoc Global Dynamic Income Fund (CHW)
Regarding REITs, I currently hold >2,450 shares across 22 REITs, with smaller position sizes. These comprise only 9.4% of my portfolio by cost. And they also represent about the same percentage of total portfolio income per year. The 5 largest REITs by cost, most held for a number of years now, are:
- EPR Properties (EPR)
- Universal Health Realty Income Trust (UHT)
- Omega Healthcare Investors (OHI)
- LTC Properties (LTC)
- National Health Investors (NHI)
The ticker symbols for the other REITS in my portfolio are: MPW, GOOD, VTR, HASI, DOC, NNN, LADR, BXMT, ONL, O, CCI, DLR, WPC, EQIX, HR, RITM, and PLD.
Outside of CEFs and REITs, individual stocks comprise the other 16% of income that my portfolio generates each year. While that income is certainly welcomed, the primary reason for holding most of the individual stocks in my portfolio is to generate gains through price appreciation, with income as a secondary value. For that reason, I now move on to talk about that strategy.
Swing Trades (Price Appreciation)
The 37% of my portfolio invested in individual stocks is the most dynamic part. I do like to trade, and while I am willing to buy and hold good stocks in order to realize price appreciation, the risk is that market volatility may reduce the return for time in the trade the longer that a stock is held. Many times, buy-and-hold means that stock prices simply go up and down and up and down as the markets digest a host of economic, political, and other events. And the worst case would be to hold a stock for years and have the “unrealized” or paper gains decline or disappear when there is a major change in the outlook due to technology, competition, or some other factor for that company. Looking at weekly 10-year charts of names such as BlackBerry (BB), Nokia (NOK), AMC (AMC) – which became a meme play, General Electric (GE), AT&T (T), 3M (MMM), and others show that unrealized gains can decline over time.
So my trading strategy is to try to catch a stock when it is selling off and out-of-favor, especially perhaps as part of an over-reaction on the part of investors to an event such as an earnings miss. There is never a guarantee that one buys at a low or bottom, and that one is not catching the proverbial “falling knife,” but experience and discipline can help to achieve a majority of winning trades. Swing trading is intended for relatively short time periods, from days to a few months, while a stock that is held for perhaps up to a year and a half would be a position trade.
My trading strategy is to look at overall periods of market strength, during which I sell or trim positions, and periods of market weakness, during which I open or add to positions. I open positions slowly and add shares incrementally, averaging my unit cost lower. I often use some technical charting ideas, as discussed previously, such as a gap below the daily 200 moving average especially on an earnings miss.
I generally trade better quality names such as stocks in the S&P 500. I often trade multiple names in sectors as they rotate to under-performing relative to the S&P. I’ve demonstrated how I do that and use the free tools provided through my TD Ameritrade account to identify, relatively easily, my trading candidates. My article from last September explains my approach in more detail. Another key for managing the risk in a trade is to limit the investment as a percentage of the portfolio. Many of my trades are on the smaller side (a few thousands of dollars), so that if any fail to work, my portfolio never blows up. With my approach, there is never pressure to sell a stock.
For 2022 year-to-date, I have been very active as this bear market has unfolded through the multiple corrective and bear bounce sub-waves. The chart below provides an indication of the variability and level of investment for my swing trading (period of Feb – Aug).

Trade Investment, by Month 2022 (author)
Year-to-date, I’ve closed 108 trades for a net profit of >$50,400, not including dividends. This was a mean gain of 25.07%, with a median gain of 23.64% and a cost-weighted gain of 22.72%. The top 20 trades are listed below, which accounted for 18.5% of the trades but 33.4% of net gains. The cost-weighted gain for these 20 was 44.5%.
| Symbol | Description | Gain (%) | |
| IRM | IRON MOUNTAIN REIT INC | 84.98 | |
| RTX | RAYTHEON TECHNOLOGIES CORPO | 72.54 | |
| SBR | SABINE RTY TR | 70.65 | |
| PBA | PEMBINA PIPELINE CORP | 61.48 | |
| CVX | CHEVRON CORP | 54.69 | |
| WMB | WILLIAMS COS INC | 52.25 | |
| CEG | CONSTELLATION ENERGY CORP | 51.67 | |
| CTRA | COTERRA ENERGY INC CL A | 46.05 | |
| MRNA | MODERNA INC | 45.26 | |
| EXC | EXELON CORP | 42.60 | |
| ALL | ALLSTATE CORP | 39.62 | |
| LMT | LOCKHEED MARTIN CORP | 37.09 | |
| ED | CONS EDISON INC | 36.65 | |
| CC | CHEMOURS COMPANY | 35.45 | |
| LNT | ALLIANT ENERGY CORP | 35.10 | |
| SRE | SEMPRA ENERGY (DOING BUSINE | 34.60 | |
| BANF | BANCFIRST CORP | 34.51 | |
| R | RYDER SYSTEM INC | 34.37 | |
| VRTX | VERTEX PHARMS INC | 33.26 | |
| ATO | ATMOS ENERGY CORP | 32.91 | |
Some of these trades were for names in the energy and utilities sectors, which I bought after the COVID selloff and for which I took profits early this year. Overall, 70 of these 108 trades were of “short” duration (less than a year) and most were less than 5-6 months. I will occasionally sell a CEF or REIT if it has appreciated a lot in price, so as to capture the gain. I also occasionally will sell partial positions, usually selling some highest cost shares and retaining the lower cost shares. I was taught to never “marry” a stock and, even if I like the stock, I will swing trade it even two or three times within 12-18 months if the price swings repeatedly and widely enough.
The point to realize is that these profits came mostly from better-quality names that, at the time, investors had thrown in the garbage can. Many were trading at new year lows when I bought them. My current portfolio may look like a basket of real losers, which many are from a price perspective. This is just a sort of a game of time on the price curve, and I like playing this game. Even in this bear market and buying the discards, more than half of the individual stocks are positive on gains. I am able and willing to wait if needed for prices to reverse.
The tickers for the 20 next most profitable trades year-to-date included: VOXX, TSN, SPWR, CHGG, GWW, LUMN, LYB, MRK, PAYC, DXCM, BLK, PSX, CAH, SIF, OGN, DE, NI, WDC, ROKU, and ETR. The cost-weighted gain for these 20 trades was 29.6% not including dividends.
I can’t begin to list all of the trades here, including the entry and exit prices, gain, and duration, but most of this information is available free to Followers on my trading blog. I update almost every day the buy and sell trades that I make. Here are a few excerpts of the information that I provide to readers through my blog:
From Update – August 15
I sold my position in DexCom Inc. (DXCM) at 92.00 for a gain of >29% in just under 3 months in the trade. This may go farther but this is a good enough trade for the time.
I sold my position in BlackRock Inc (BLK) at 756.50 as it reached the daily 200, for a gain of about 29% for 3 months in the trade.
I sold my position in Embecta Corp (EMBC) on the gap up on earnings for a gain of about 18.8%. I started buying this after acquiring shares through the spinoff from Becton, Dickinson in April.
From Update – August 10
I sold my position in Etsy (ETSY) at 116 for a gain of 40.79% for less than 3.5 months in the trade. This was my 3rd swing trade in this name in the past year or so.
From Update – July 29
I sold my position in Grainger (GWW) at 530 for a gain of about 30% not including dividends. Grainger gapped up today on earnings to a new all-time high. I entered this past September.
I sold my position in Constellation Energy Corp (CEG) at 65.50 on the huge gap up following yesterday’s Inflation Reduction Act (Climate Spending) action. The gain was >51% not including dividends. I acquired spinoff shares from Exelon in Sept and added thru Feb. We’ll see if the gap gets filled.
I sold my position in Hercules Capital (HTGC) at 15.50 for a gain of about 18.8% for 1.5 months in the trade. There are several downgrades on yesterday’s earnings. The stock tagged the daily 100 and I don’t think it will continue advancing at this time.
And here’s an example from June 27 for a stock Buy posting:
I re-opened a position in Dow Inc. (DOW), below my previous low. I last opened this trade in late Sept. ’21 and sold in mid May at an average of 69.41, for 26.4% for 8 months in the trade. Dow is currently rated a Buy by CFRA and Very Attractive by New Constructs, ranking 15th of the 145 Basic Materials stocks covered. It also is well rated recently by SA contributors. I’ll add if this goes lower.
I use charts extensively for visualizing the price extremes for stocks on shorter time frames. Below is an example of my trade for BlackRock (BLK).
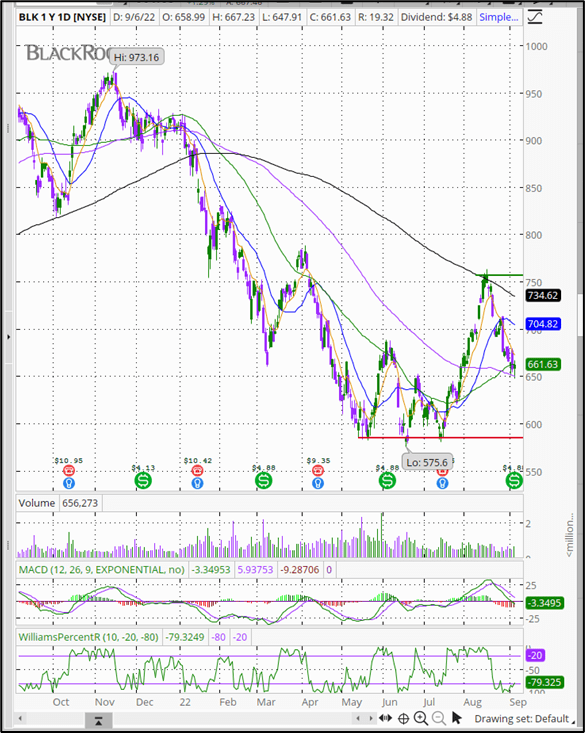
BLK Trade (Author)
In this example, I bought the stock on 5/16 at 585.00 (red horizontal line) after it had sold off for previous half year. After bouncing around a bit at that level over the next two months, the stock reversed to the upside. I sold on 8/15 at 756.48 (green horizontal line) when it tagged the daily 200 MA, for a gain of 29.31% for 3 months in the trade. Importantly, this trade followed the general market pattern: the stock sold off from January through June and then rebounded into August. This was that sub-b wave bounce within the unfolding C wave of the A-B-C that I outlined earlier. Since the sell, BLK has given up half of those gains. My trade log shows the dates and prices at entry and exit, and percent gain:
| BLK | BLACKROCK INC CL A | 05/16/22 | 585.00 | 08/15/22 | 756.48 | 29.31 | S |
(Source: TD Ameritrade trade log)
Another example for essentially the same price pattern is provided below for my trade in Deere & Co (DE). While I caught the low fairly well on this one, I left some profits on the table by selling a tad too soon. As the trade log below shows, I opened the position and added shares the following day. Deere has also now pulled back below my exit level.
| DE | DEERE & CO | 07/05/22 | 289.00 | 08/16/22 | 367.99 | 78.99 | 27.33 | Short |
| DE | DEERE & CO | 07/06/22 | 286.00 | 08/16/22 | 367.99 | 81.99 | 28.67 | Short |
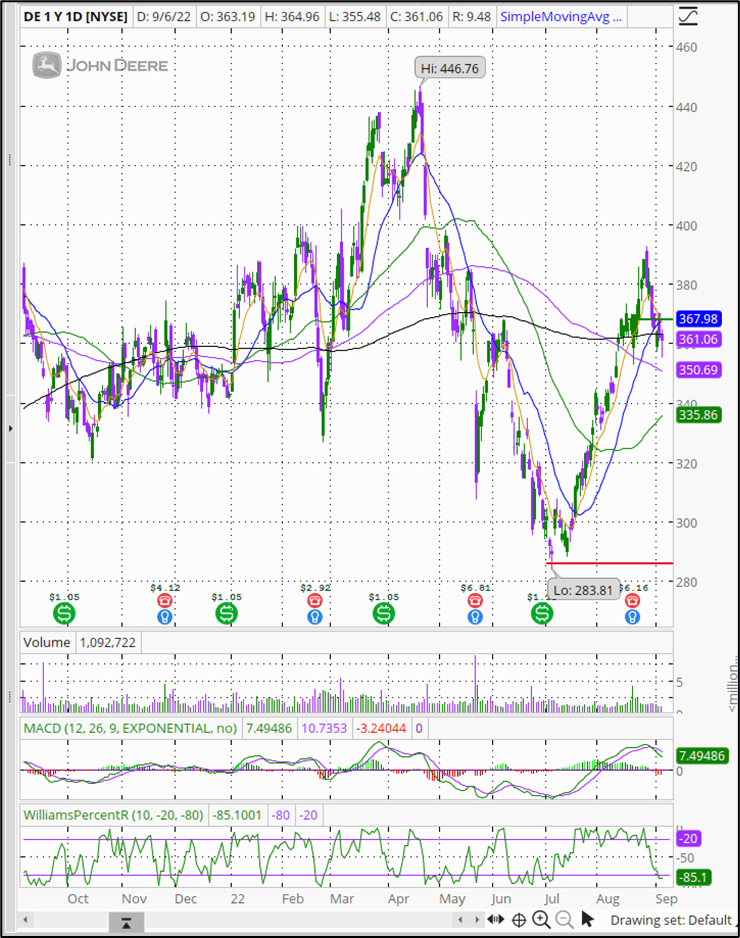
DE trade (author)
These are good examples of shorter-term swing trades that worked very well. I am not suggesting that all of my existing holdings will see a strong trend reversal, but I am able to realize a lot of gains on good chart set-ups and am also able to wait patiently for stocks to regain their up-trending pattern. Using price charts, adding shares incrementally, and controlling the size of my trades increases my success and means that I never panic over any trades that might “go south” on me.
I do not use formulas or have any hard and fast rules for when to take profits. Sometimes tagging a moving average or hitting a Fibonacci sequence level will say that the trade was “good enough.” This is a satisficing approach. I pay attention to the general market sentiment and volumes as that reflects conviction – or lack thereof – behind a strong price move. I also look at the momentum in terms of time behind the stock’s reversal from a steeper selloff. I have always been taught to realize that every day in a trade is potential risk.
Current Portfolio
I currently hold 123 individual stocks. As I have indicated, my portfolio changes nearly every week, so a detailed listing here is not as meaningful as perhaps following my trading blog. My holdings change largely due to the macro market direction of prices (i.e., Elliott waves) and the sector rotations relative to the performance of the S&P 500. To a large degree, “reading” the continuum of performance using my TD Ameritrade sector tool is the key to my successful swing trading.
The current sector status (as of 9/7) is presented below for the past 30 days, and overall it is clear that there are many beaten down stocks across most of the S&P 500 sectors. This is the TD Ameritrade sector tool.
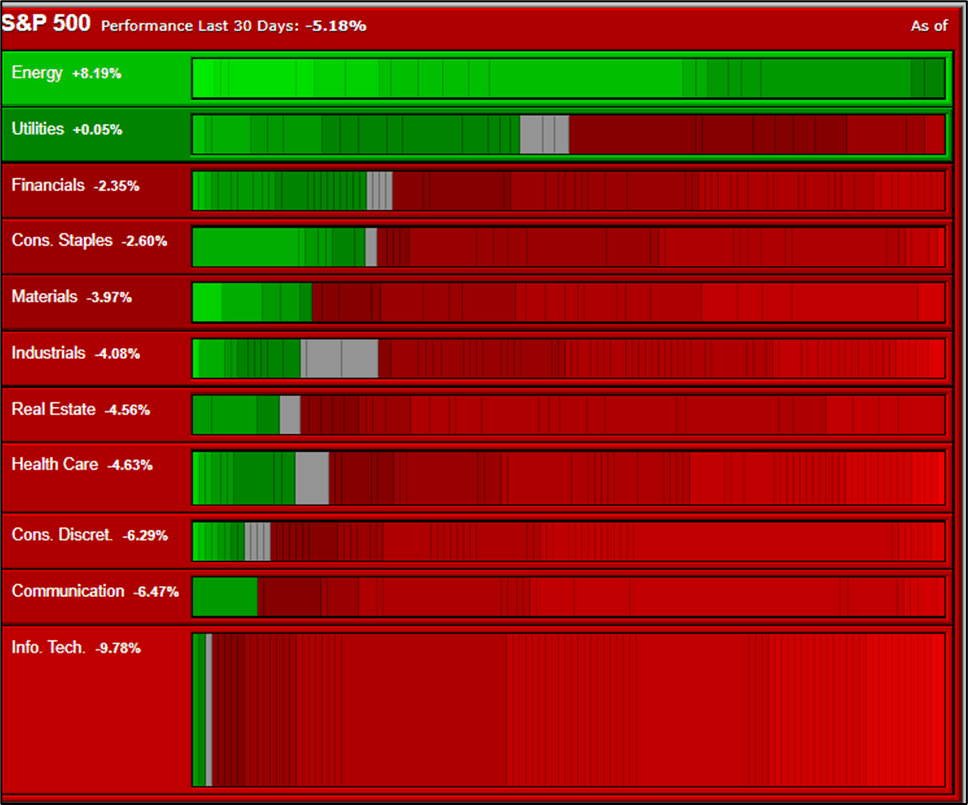
TD Ameritrade Sector Tool (TD Ameritrade)
The current allocation of investment is presented by sector in the table below. For those who followed my articles from last year, this represents a significant rotation across the major sectors.
| 22.7% | INFORMATION TECHNOLOGY |
| 14.8% | INDUSTRIALS |
| 13.1% | HEALTH CARE |
| 11.0% | UTILITIES |
| 10.1% | COMMUNICATION SERVICES |
| 9.3% | CONSUMER DISCRETIONARY |
| 6.5% | MATERIALS |
| 6.1% | FINANCIALS |
| 4.3% | CONSUMER STAPLES |
| 2.0% | ENERGY |
In lieu of a detailed discussion of current holdings, I list below the current portfolio tickers, by sector, in order of cost, as of the end of August. This may be useful for those who have asked me for a portfolio update:
- Information Technology – WU, GPN, V, CTXS, PTC, IPGP, MA, GLW, DOCU, CRM, ADBE, TXN, INTC, MU, ADSK, UPLD, NOW, KTCC, TER, FIS, G
- Industrials – MMM, SWK, B, CP, CMI, PCAR, TREX, GE, ITW, PNR, NSC, AGCO, TEX, DOV, ULBI, MTZ, MAS, ROP, CAT, FBHS, LUV
- Health Care – NVAX, TFX, PRGO, BAX, HOLX, VTRS, EXAS, RARE, ALGN, MDT, BDX, XRAY, ABT, SNY, GILD, BIO, MRNA
- Utilities – PNW, D, AES, WEC, AEP, PPL, BKH, AWK, LNT, SO, ATO, NEE, EVRG, DUK, NRG, ES, BEP
- Communication Services – VZ, PYPL, T, NFLX, WBD, CHTR, CMCSA, BCE
- Consumer Discretionary – HD, LEG, PENN, MHK, JOUT, VRA, F, DHI, LEN, WHR, PVH
- Materials – SMG, IP, BALL, APD, CE, PPG, RYAM, LIN, DOW, LYB
- Financials – MKTX, MAIN, OTCQB:FNMA, PFC, WTW, CSWC, STT, BAM, MC, JPM
- Consumer Staples – CLX, WBA, CL, NHTC, MDLZ
- Energy – EPD, ENB
The preferred stock that I hold is BPYPM.
Final Thoughts
So far, 2022 has been characterized by a nasty bear market. Perhaps the worst has yet to come. I look at this market volatility as an opportunity to add to core income holdings such as my CEFs and REITs and to swing trade individual stocks including many beaten down components of the S&P 500. With my two part strategy, I will earn >$47k in dividends/distributions this coming year, and I have already banked >$50k in swing trade profits YTD. These are profits in a bear year on the underlying portfolio.
The first part of my portfolio is increasingly the largest by cost but it is also increasingly a “set-it and forget-it” component. It generates income every month that is forever tax free in my Roth IRA. My second portfolio component is as successful as I am able to identify and profit from the shorter-term price trend reversals of stocks, especially the elite group that comprise the S&P 500. This is long-only trading (no options or margin account). This is an approach that I have tweaked and that works well for me.
I hope that readers have found some useful ideas here and wish all well for your own investing/trading. Please do your own due diligence. If you elect to Follow, you have free access to my trading blog, which I will continue to update as I buy and sell stocks, and occasionally comment on the market pattern. Note that the publish date for the blog is 10/2/21 – new posts are listed as updates.
I welcome your comments or questions.
=Green=
Techyrack Website stock market day trading and youtube monetization and adsense Approval
Adsense Arbitrage website traffic Get Adsense Approval Google Adsense Earnings Traffic Arbitrage YouTube Monetization YouTube Monetization, Watchtime and Subscribers Ready Monetized Autoblog
from Trading Strategies – My Blog https://ift.tt/eqNTfXy
via IFTTT


