
Scott Gries
Throughout history, by a combination of technological innovations that created the necessary infrastructure and the advancements in terms of the average level of financial education, there has been a very clear and distinct trend of stock market investing slowly moving away from the professionals and becoming more mainstream adopted henceforth a trade that is practiced by the everyday man.
Early on, years before the birth and popularization of social media, it was the major media conglomerates that capitalized on this process by launching multiple finance and investing-related television shows that were almost predominantly oriented in both style and substance to the retail investor. One of the pioneers in this space was CNBC, and there is one name that has become almost synonymous with finance television: Jim Cramer.
In today’s article, we will leverage the alternate datasets we have collected on CNBC’s major TV shows over the past couple of years in order to review his stock-picking decisions, benchmark his results against the market, and ultimately see how we can harvest the power of big data in order to attempt to deliver alpha on the market. We present to you our new trading strategy that is based on the data that was collected on the CNBC host, where we have built a trading mechanism that is by design inverting most of Cramer’s top-mentioned stock recommendations, which so far has proved successful in generating alpha on the market.
The Jim Cramer Report
While many look upon finance TV shows today as not much more than cheesy entertainment, there is no question that the shows themselves still have a loyal following and are some of the highest-rated programming on cable TV.
Long gone are the days where Mad Money and other CNBC live shows could generate close to half a million viewers per night, but the data clearly points to the fact that they still remain to be a relevant platform, maintaining a viewership base of around 200,000 throughout the year.
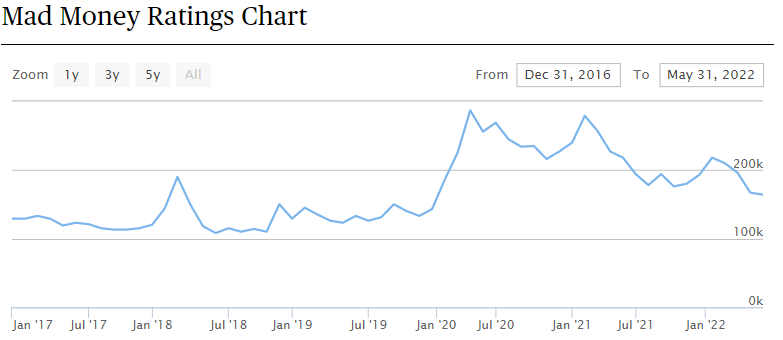
Mad Money Ratings (Cable Rankings)
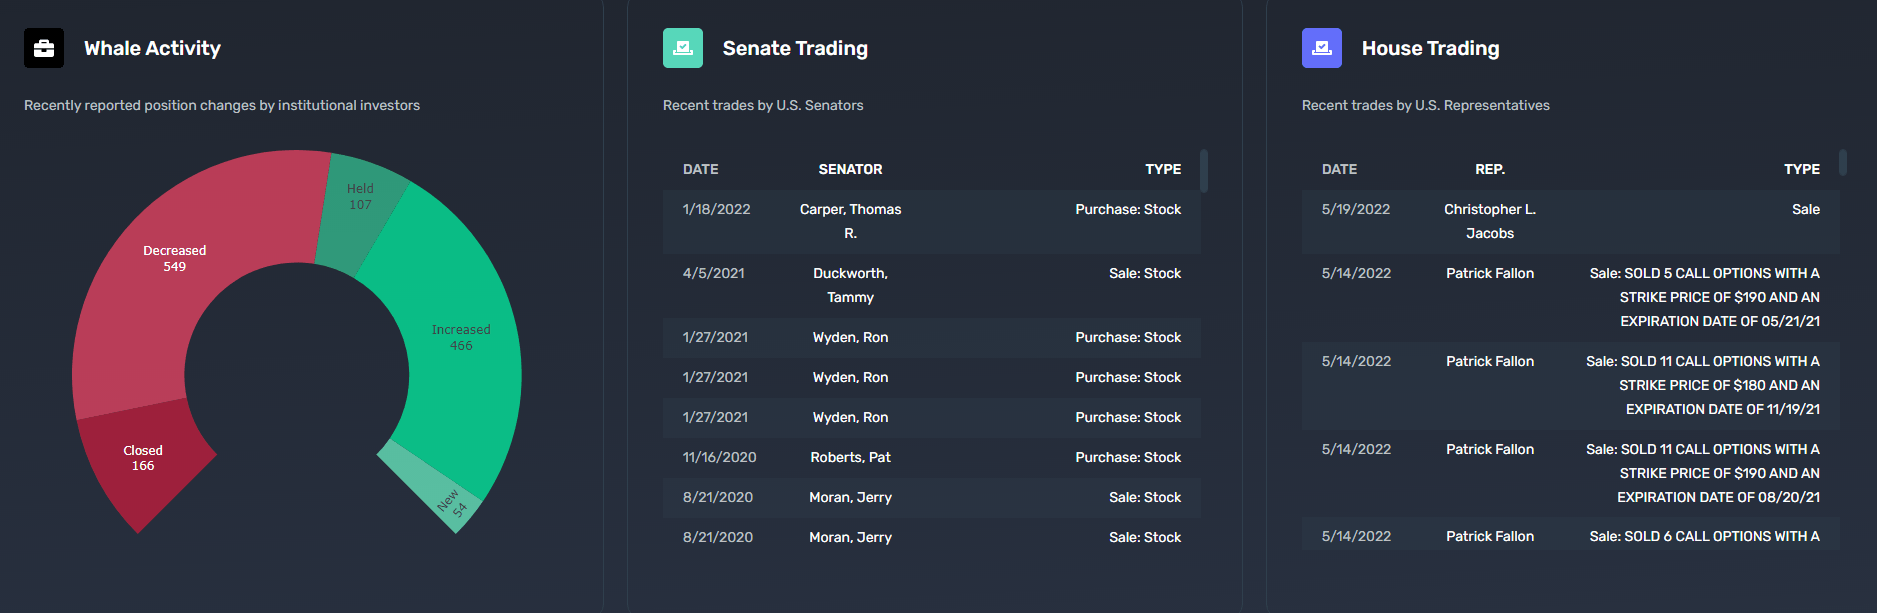
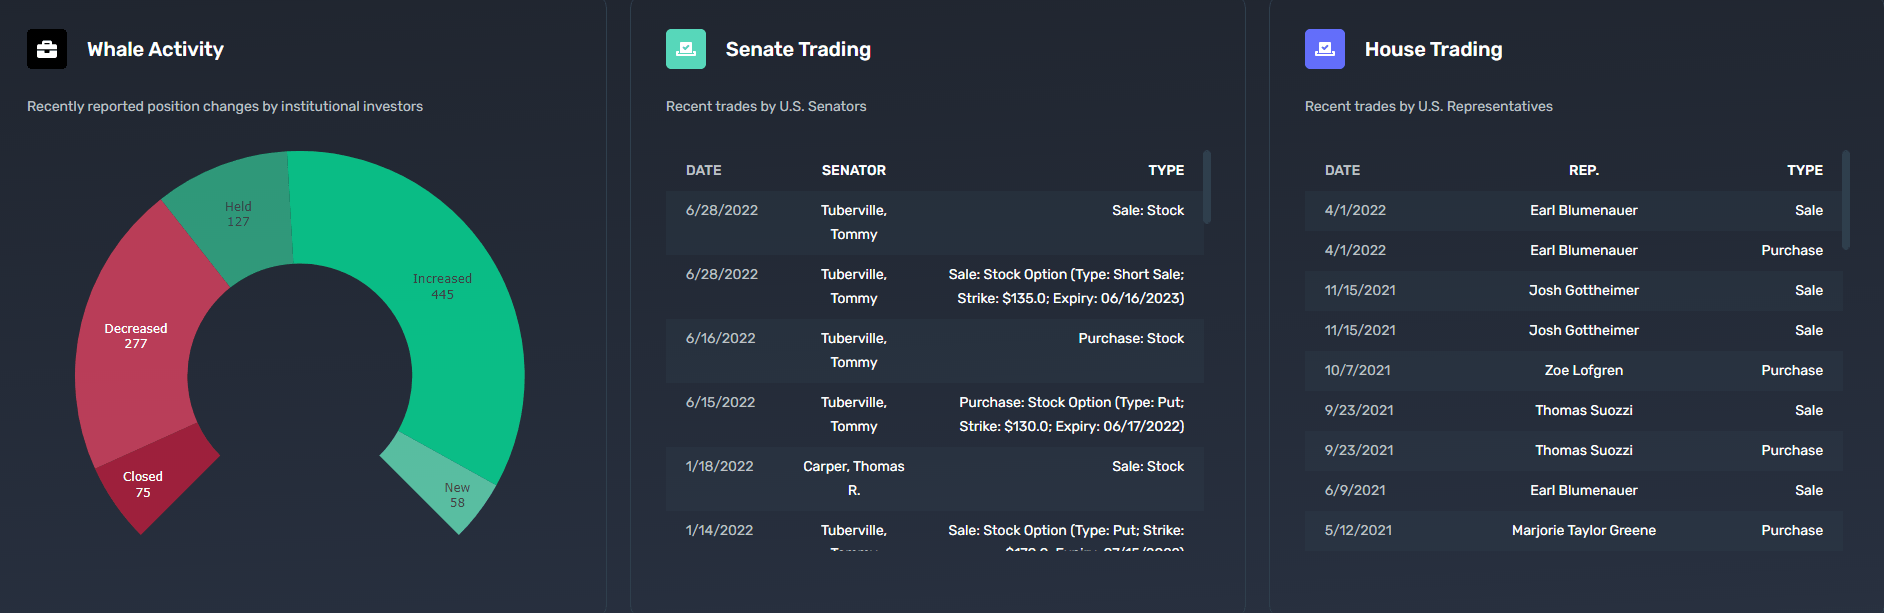
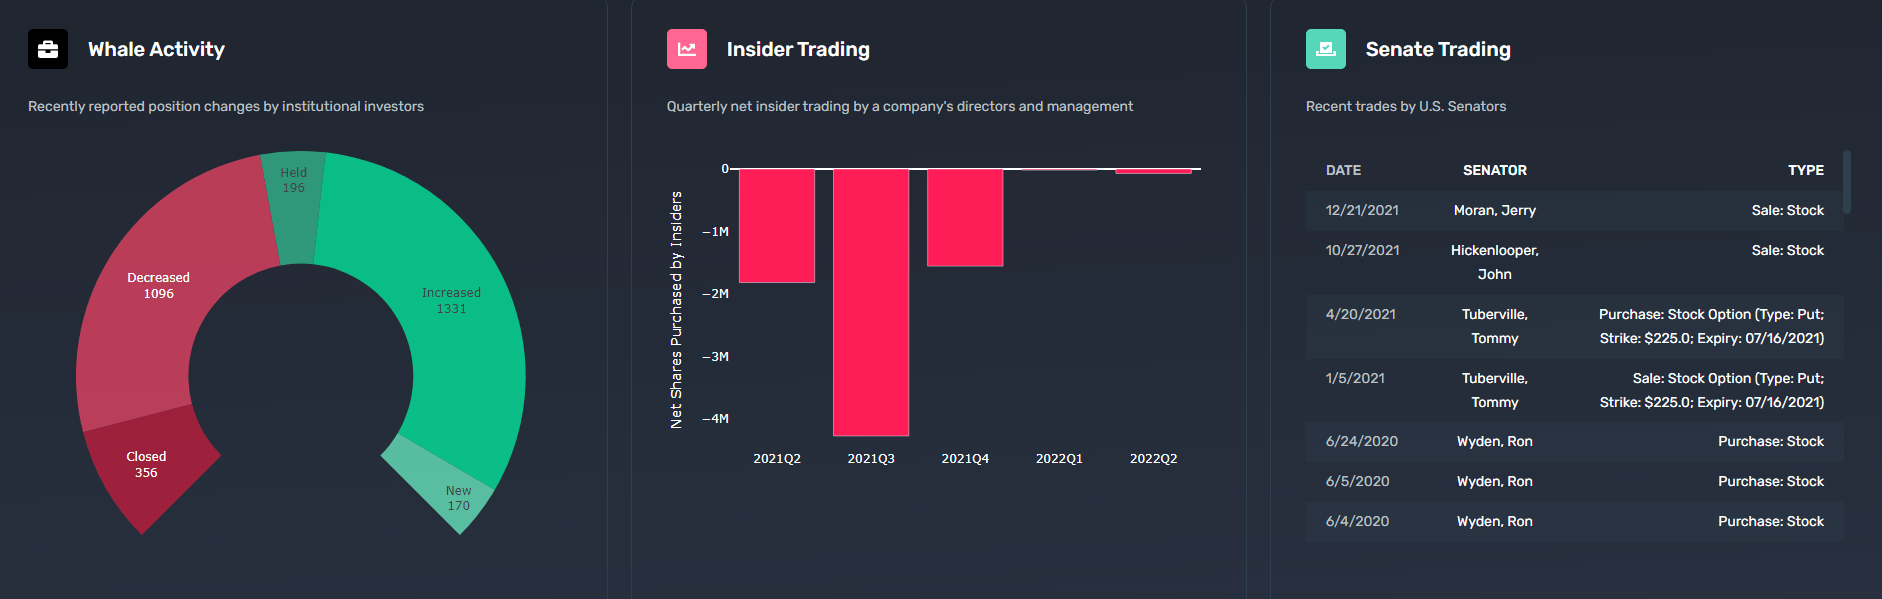
This is exactly where we see the true value of being able to track and organize such data. There are hundreds of stock recommendations per month going in both directions across all the CNBC Finance TV Show, and we have been collecting all of them for years in order to be able to backtest the data and create unique trading strategies on top of it.
Even if the recommendations are able to influence only a small percentage of their viewer base in the stock-picking process, it would still have an impact on the traded volumes of the underlying asset that is being discussed or at least have a similar result indirectly through the expectation for the underlying asset to be affected.

CNBC Shows Ratings (Cable Rankings)
In today’s article, we take a look at the performance of a host whose name become almost synonymous with finance TV throughout the years, none other than Jim Cramer. His stock recommendations helped guide generations of investors, sometimes for the better, while his critics would be quick to mention that it was often for the worse.
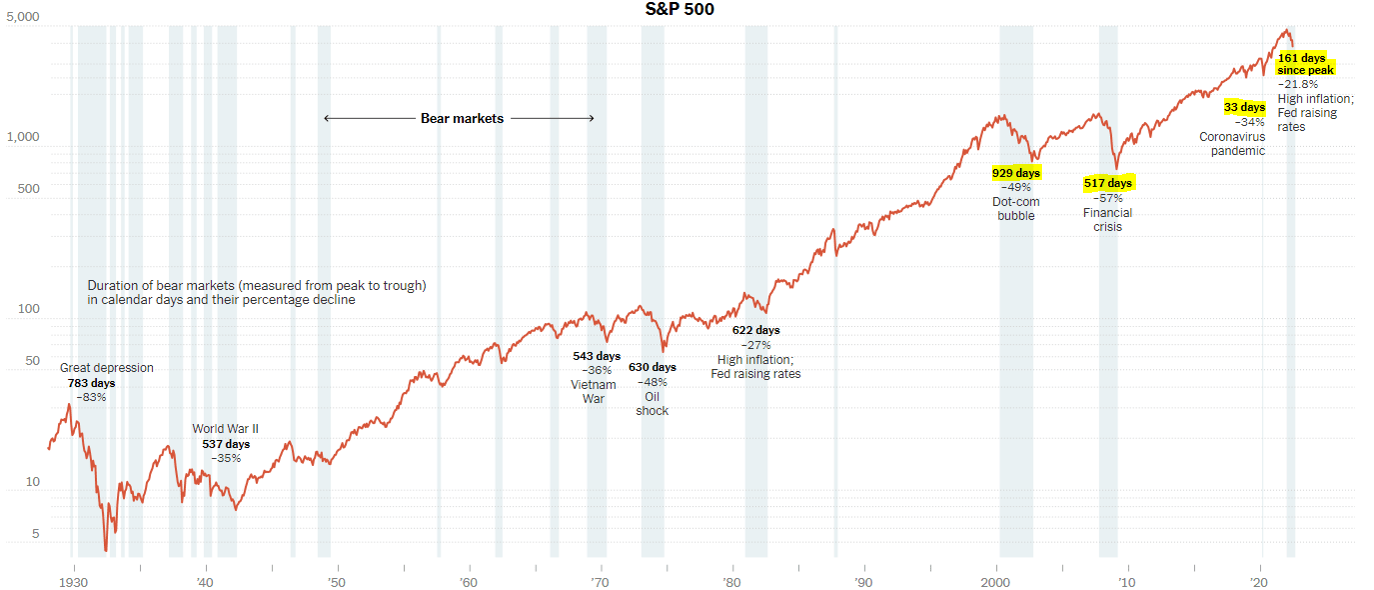
S&P Bear Market History (New York Times)
Jim Cramer has lived through the last seven bear markets and has actively participated in the market in one way or another during the last four bear markets, including the dot-com bubble, the financial crisis, the relatively short pandemic bear market, and the current ongoing bear market, making his experience valuable. So let us see how his stock picks carried with the market downturn that saw the S&P 500 (SPY) lose more than 14% of its value since the beginning of the year. Up until this point in the year, Jim Cramer has made a grand total of 876 stock buy recommendations or has otherwise expressed bullish views on individual stocks. Here is our list of Jim’s top ten most recommended stocks measuring the performance from the first to the last buy recommendation:
Procter & Gamble (PG)
-
QuiverQuant Ranking: #1
-
Total Buy Recommendations: 24
- First Recommendation: 3rd of March
-
Last Recommendation: 29th of July
-
Performance Tracker: -10.03%

Procter & Gamble QQ Report (Quiver Quantitative)
Walt Disney (DIS)
-
QuiverQuant Ranking #2
-
Total Buy Recommendations: 22
- First Recommendation: 23rd of February
-
Last Recommendation: 21st of July
-
Performance Tracker: -29.03%
Disney QQ Report (Quiver Quantitative)
Qualcomm (QCOM)
-
QuiverQuant Ranking #3
-
Total Buy Recommendations: 16
- First Recommendation: 3rd of January
-
Last Recommendation: 11th of May
-
Performance Tracker: -28.95%
Qualcomm QQ Report (Quiver Quantitative)
Constellation Brands (STZ)
-
QuiverQuant Ranking #4
-
Total Buy Recommendations: 15
- First Recommendation: 5th of May
-
Last Recommendation: 11th of July
- Performance Tracker: -4.27%
Constellation Brands QQ Report (Quiver Quantitative)
Morgan Stanley (MS)
-
QuiverQuant Ranking #5
-
Total Buy Recommendations: 14
- First Recommendation: 24th of February
-
Last Recommendation: 11th of July
- Performance Tracker: -17.41%
Morgan Stanley QQ Report (Quiver Quantitative)
Johnson & Johnson (JNJ)
-
QuiverQuant Ranking #6
-
Total Buy Recommendations: 14
- First Recommendation: 20th of April
-
Last Recommendation: 25th of July
- Performance Tracker: -6.21%
Johnson & Johnson QQ Report (Quiver Quantitative)
Halliburton Company (HAL)
-
QuiverQuant Ranking #7
-
Total Buy Recommendations: 14
- First Recommendation: 8th of March
-
Last Recommendation: 26th of July
- Performance Tracker: -22.76%
Halliburton QQ Report (Quiver Quantitative)
Meta Platforms (META)
-
QuiverQuant Ranking #8
-
Total Buy Recommendations: 14
- First Recommendation: 4th of April
-
Last Recommendation: 1st of June
- Performance Tracker: -19.34%
Meta QQ Report (Quiver Quantitative)
Pioneer Natural Resources (PXD)
-
QuiverQuant Ranking #9
-
Total Buy Recommendations: 11
- First Recommendation: 17th of March
-
Last Recommendation: 21st of July
-
Performance Tracker: -9.25%
Pioneer Natural Resources QQ Report (Quiver Quantitative)
Marvell Technology (MRVL)
-
QuiverQuant Ranking #10
-
Total Buy Recommendations: 11
- First Recommendation: 28th of February
-
Last Recommendation: 7th of July
- Performance Tracker: -31.80%
Marvell QQ Report (Quiver Quantitative)
Besides our list of the most recommended stocks, Jim Cramer seems to have taken a particular liking to: Danaher (DHR), Costco Wholesale (COST), Coterra Energy (CTRA), Humana (HUM), Alphabet (GOOG), Bausch Health Companies (BHC), Eli Lilly and Co. (LLY), Enterprise Products Partners (EPD), Airbnb (ABNB), Hertz Global Holdings (HTZ), Devon Energy (DVN), Rio Tinto (RIO), Microsoft (MSFT), SoFi Technologies (SOFI), Tellurian (TELL), and others.
On the other hand, more notable “sell” or “trim” recommendations by the Mad Money host during this year include companies like ZIM Integrated Shipping Services (ZIM), Chevron Corporation (CVX), Intel (INTC), Norwegian Cruise Line Holdings (NCLH), Roblox Corp. (RBLX), Rivian Automotive (RIVN), Shopify (SHOP), Upstart Holdings (UPST), American Eagle Outfitters (AEO), Amazon (AMZN), Boeing (BA), Coinbase (COIN), Mastercard (MA), NortonLifeLock (NLOK), Nvidia (NVDA), Rocket Companies (RKT), Roku (ROKU), AT&T (T), and others.
Our Approach and Strategies
With the idea of benefitting from the datasets collected, we have created the “Inverse Cramer” Strategy, which approaches the data in a rather interesting and unique way.
The strategy tracks the performance of companies that have been most recommended by the popular TV host over the course of the past month. It does that by opening a short position in the top-most recommended companies while hedging it with a long position in the market index. The strategy uses an equal-weighted portfolio, with an implemented system of weekly rebalancing. This approach was successful in generating a CAGR rate of 26.18% given its inception date of the 1st of January 2021. It has a one-year return of 20.13%, as compared to the S&P500 which generated a negative 6.29% return.
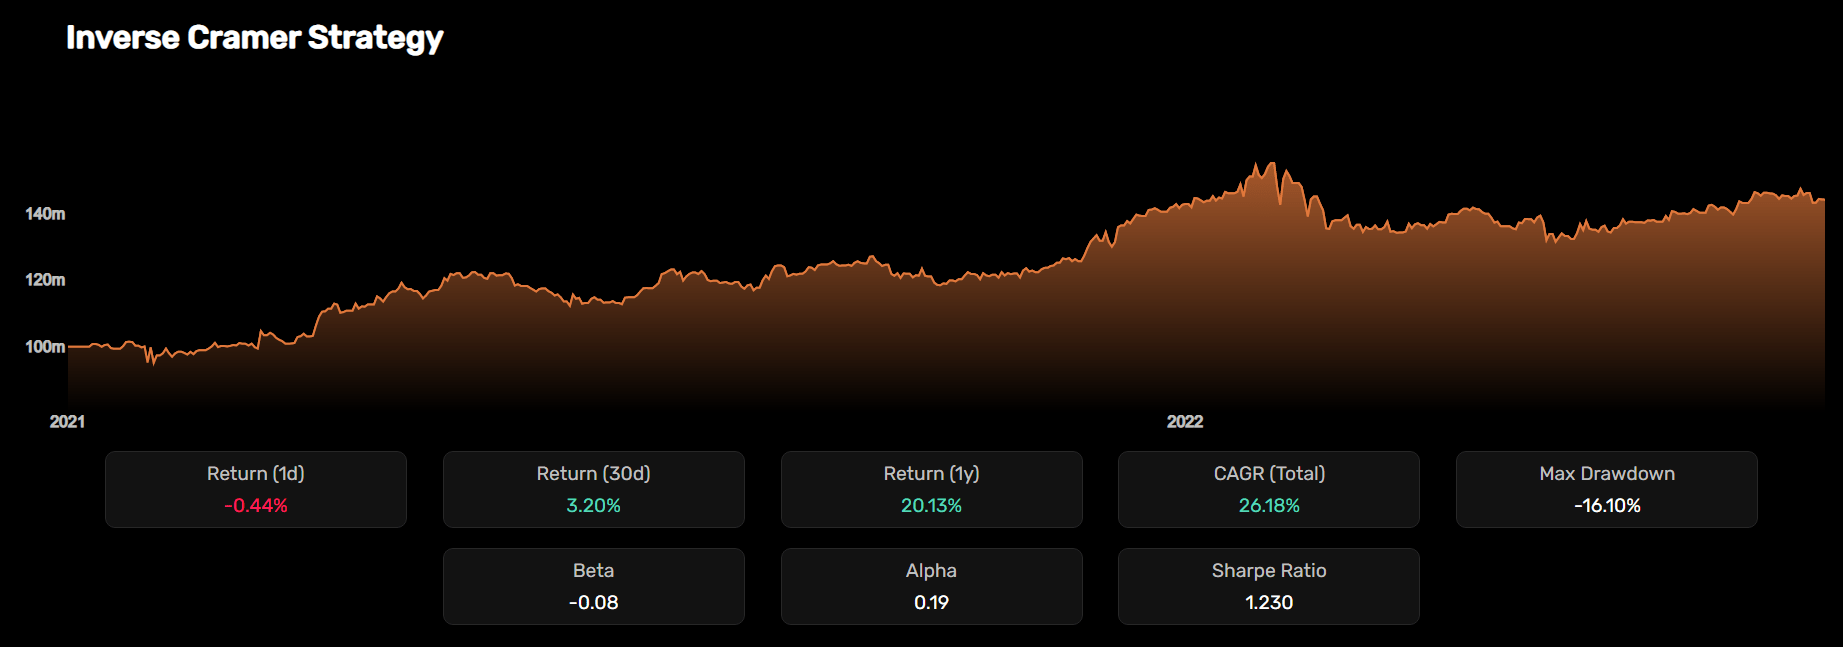
Inverse Jim Cramer Strategy (Quiver Quantitative)
The biggest short position at the moment in the strategy is in the Archer-Daniels-Midland Co. (ADM), currently weighted at 9.23%. This position is shortly followed by the 9.05% short on Disney (DIS) and the 9.01% short on Johnson & Johnson (JNJ). If one were to have invested $100 million in inverting the famous TV personality’s stock recommendations at the beginning of 2021, the same investment would have compounded to $144 million as of today, which is slightly off the June high, when the portfolio hit its peak of almost $152 million.
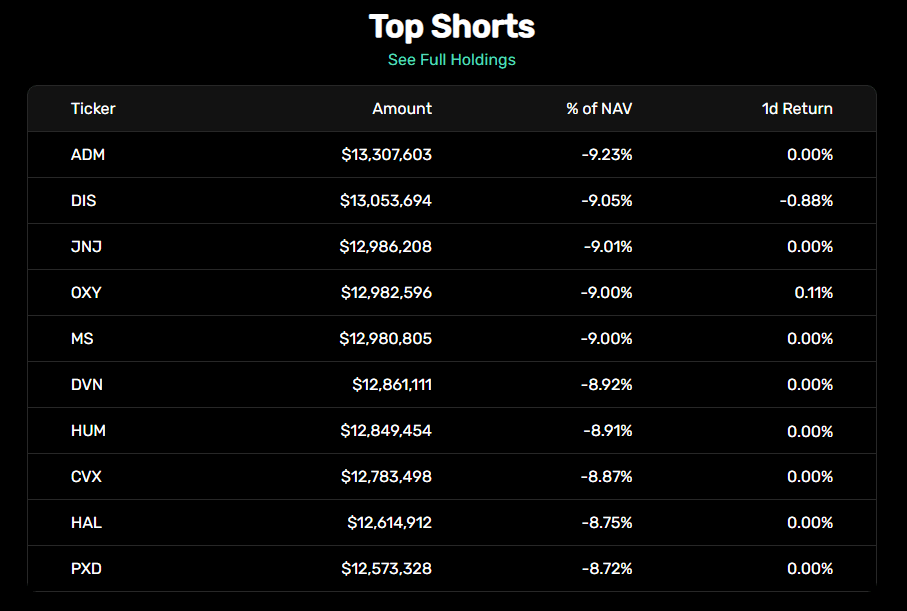
Top Short Positions (Quiver Quantitative)
Final Thoughts and Conclusions
While often the target of criticism for his slightly lackluster stock-picking performance, the Mad Money host is without a doubt one of the most influential TV personalities in the history of finance TV. However, it remains a given that his stock picking abilities seem to have slowly deteriorated over the years. When indexing his stock picks weighted by the frequency of his on-air buy recommendations, they seem to on average produce what are far from excellent year-to-date results, often underperforming the market. This is what has led us on the path of creating a trading strategy that allows us to inverse the trades recommended by the Mad Money legend.
There is value to be had in measuring the sentiment of CNBC’s charismatic hosts such as Jim Cramer, given that the stocks that are most often recommended or frowned upon are destined to have additional trading volume generated thanks to the influence of hosts like Jim Cramer’s, or simply by the illusion of influence other investors expect. From a once reputable and well-respected hedge fund manager who is making money from investing, Cramer shifted and created an even more successful business out of delivering content for investors, not necessarily having to worry about the success rate of his stock picks. Nowadays, being more concerned with appearances and ratings numbers, he appears to follow a philosophy that the more outrageous and controversial the stock picks, the better. While outlandish and controversial may lead to good ratings, this philosophy, combined with the large numbers of recommendations he has to make, ultimately has led to poor returns.
Like we said earlier, the TV host has made close to 900 stock recommendations this quarter alone. However, this can be used to the advantage of the average investor, as his underperformance becomes solidified to the point where inverting his stock recommendations in actuality delivers alpha on the market, thereby presenting an interesting and possibly lucrative investment strategy.
Techyrack Website stock market day trading and youtube monetization and adsense Approval
Adsense Arbitrage website traffic Get Adsense Approval Google Adsense Earnings Traffic Arbitrage YouTube Monetization YouTube Monetization, Watchtime and Subscribers Ready Monetized Autoblog
from Trading Strategies – My Blog https://ift.tt/a9GQztM
via IFTTT


